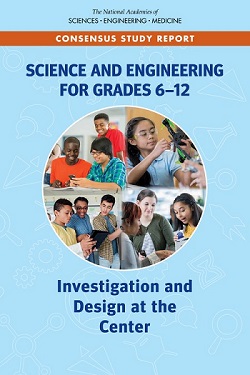
NAS report on how to improve experiences for all students as they investigate science and engineering
Placing science investigation and engineering design at the center of my classroom requires I abandon several traditional approaches to instruction. Gone from my science classroom are the days of beginning instruction by having students open the textbook to the first page of a unit and then copy vocabulary terms from the yellow box into their notebook. The students no longer complete labs following the scientific method to verify what I told them the day before.
Now, science investigation and engineering design have become the central approach for teaching and learning science and engineering in my classroom as recommended in Science and Engineering for Grades 6-12: Investigation and Design at the Center (NASEM, 2019).
The committee that developed this consensus report concluded that investigation and design are more effective for supporting learning than traditional teaching methods. In this blog, I will discuss how I use two interactive infographics from the report to guide and advance my teaching. In particular, I will describe: 1. What are they 2. Why they are valuable 3. How to use them.
These two infographics are supporting resources from the report that help teachers guide, structure, and facilitate a learning environment to allow student engagement in three-dimensional student performances.
The teacher guidance infographic delineates five research-based goals for students and actions teachers can take to support their students
The student engagement infographic emphasizes select features of investigation and design such as,
These select features of investigation and design all center around students learning to make sense of the natural and engineered world. Both infographics are instructional resources that build from the current research on how students learn and align to the new vision for science education.
The infographics provide value by prompting me to reflect on classroom dynamics, specifically what I do as a teacher to initiate three-dimensional science performances and how the students respond. I think of this as a teaching and learning couplet. For example, in the past my classroom discussion would follow the teacher Initiation, student Response, and teacher Evaluation (IRE) sequence, which helped the students memorize facts but did not explicitly support complex reasoning.
I now embrace a classroom discussion model where students make their thinking visible in multiple ways. They question sources of evidence to determine why some evidence may be more reliable and they generate models to explain their data. This approach helps my students synthesize their reasoning and provides students with greater ownership of their own learning.
The infographics also emphasize that students generate artifacts that communicate their reasoning. These artifacts help the students demonstrate their reasoning and understanding of the world around them instead of just describing what they did in class. Both infographics emphasize how teachers of science can provide multiple opportunities during instruction for students to demonstrate reasoning and show conceptual understanding of scientific explanations of the natural and engineered world.
As the current president of the Science Teachers Association of New York State (STANYS), I have encouraged our members to make a copy of each one-page PDF infographic to keep in their lesson plan book. STANYS members have stated to me that the infographics have served as a reflective tool in preparing weekly lessons and as a quick check to ensure that recommendations from the report pervade daily instruction. During professional development workshops I offer, each participant is provided with a hard copy of the infographics. I did this at a week-long science professional development institute here in New York last summer and this action was very well received.
In my classroom, I facilitate investigations that aim to pique student curiosity and lead to greater interest and identity in science and engineering.
Questions I ask myself include:
All deserve my thoughtful response as students plan and carry out investigations.
I have also used these infographic resources as talking points during department meetings with fellow teaching colleagues in my school and district. Additionally, I have shared the infographics with parents during school open house and at parent-teacher conferences to explain changes in the teaching and learning of science and engineering. Earlier this Spring, several new guidance documents for Principals, for School Boards, and for School District Science Leaders were released to support education shareholders in developing policies and making decisions reflective of the conclusions and recommendations from the report.
These infographics bring to the fore the implications of the report in a meaningful way. They provide guidance to assist educators in designing, implementing, and assessing investigation and design. The infographics serve to reinforce that investigation and design hold a prominent place- at the center of the classroom dynamic. I appreciate the work of the committee who developed this consensus report and hope that others will find the report and accompanying infographics valuable to support quality science education.

Kenneth L. Huff is a middle school science teacher in the Williamsville Central School District in New York. Kenneth is the current president of the Science Teachers Association of New York State and a board member of the National Science Teaching Association. He is a member of the Committee on Science Investigations and Engineering Design Experiences in Grades 6-12.